
Recall the graph of the exponential function y=e^x.
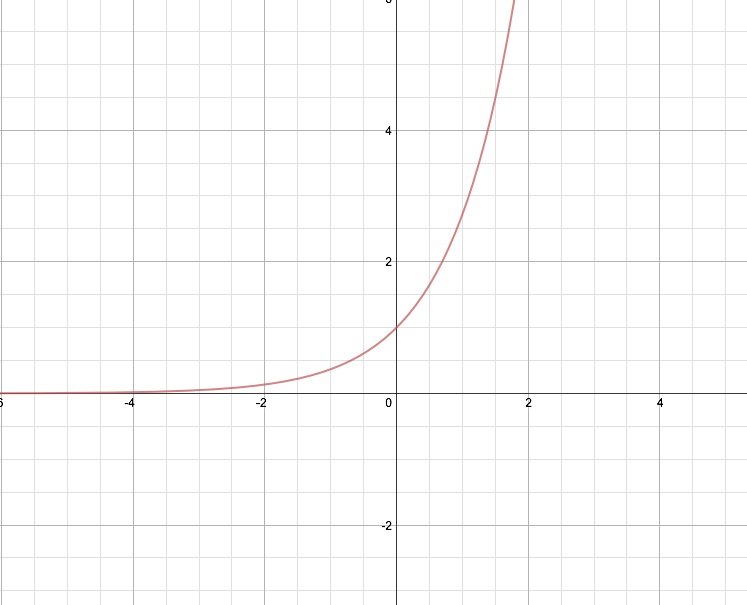
This is a graph of the equation y=ae^(bx)+c, with a, b, and c all equal to 1.
Let's observe how the graph changes as the values of a, b, and c change.
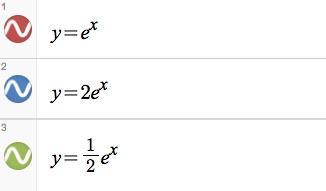
Looking at the examples above we see that the value of a stretches or shrinks the function.
When the value of a is greater than 1, the y values of the function are increased, which "stretches" the graph vertically.
When a is less than 1, the y values of the function are decreased, which "shrinks" the graph vertically.
The value of a also changes the y-intercept of the function.
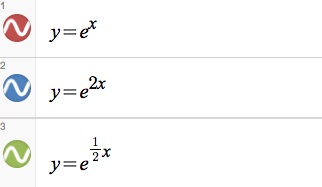
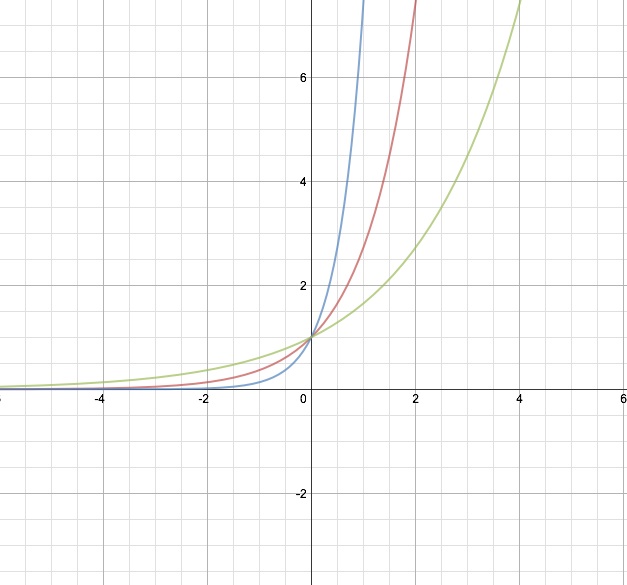
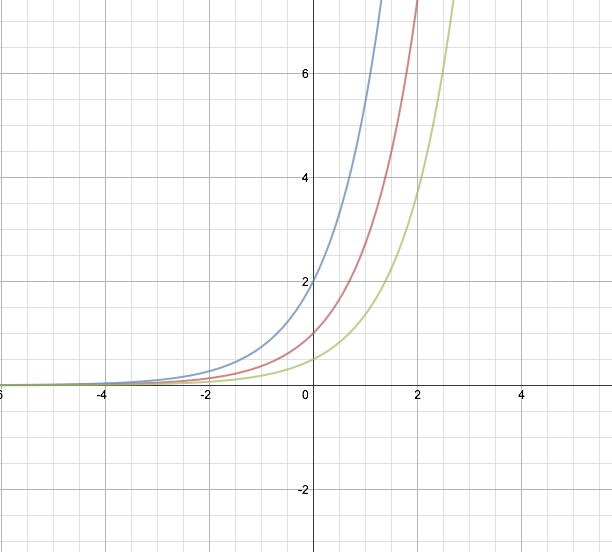
Looking at the examples above we see that as the value of b affects the rate of change of the function.
If the value of b is greater than 1 the rate of change increase. If the value of b is less than one the rate of change decreases.
We see that this change in rate does not effect the y-intercept at all.
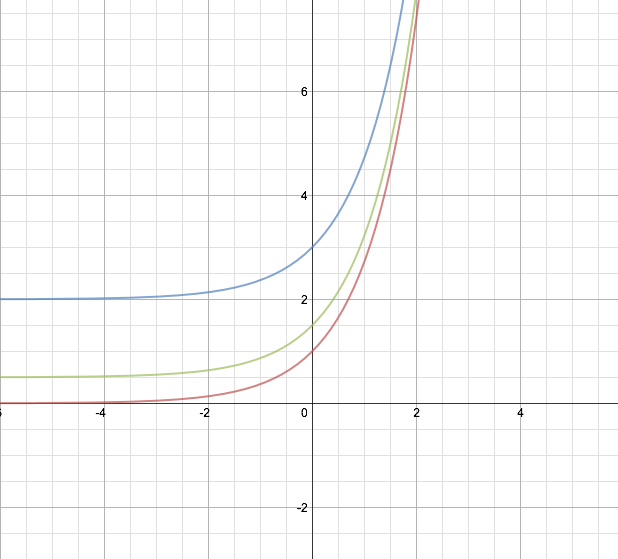
Looking at the examples above we see that as the value of c changes the graph is shifted vertically.
The asymptote of our original function, y=e^x, is x=0.
We see as the value of c changes the asymptote is shifted. The asymptote of y=e^x+2 is x=2, and the asymptote of y=e^x+(1/2) is x=(1/2).
Though the asymptotes and y-intercepts of the graphs have shifted, the rate is the same for all three functions.
Using the examples above we can better determine what the graph of an exponential function will look like prior to graphing it.
Using y=e^x as a reference, we will be able to determine the y-intercept, the rate of change, a vertical stretch or shrink, or vertical shifts using the values of a, b, and c.